What is conversational banking?
The financial industry is undergoing a digital revolution, with traditional methods of banking being replaced by faster, more efficient, and…
Read moreThings Solver: Agentic AI + Customer 360 + Data Management
11. 01. 2018.

The problem of anomaly detection is a very challenging problem often faced in data analysis. Whether it is about clustering, classification or some other machine learning problem, it is of great importance to identify anomalies and handle them in some way, in order to achieve optimal model performances. Furthermore, anomalies could often influence the analysis results, which could be the cause of drawing wrong conclusions, affecting the making of important business decisions. Thus, in every data analysis, it is required to accurately define anomalous behaviour in a certain domain, apply appropriate anomaly detection model, extract anomalies from the rest of the data and then continue with the analysis, model application and conclusion drawing.
Although anomalies are often considered to be some kind of irregularities inserting the noise in the data, they can contain more information within, than it is earlier believed. The term “anomaly” is often (and I would say wrongly) used as a synonym for the term “outlier”. That is not a huge mistake, since the whole world is using them as synonyms. I like to differentiate them by describing their difference in the following way: an “outlier” is an instance that differs significantly from the rest of the instances based on its values, or happens randomly and rarely in comparison with the rest of the instances, and thus, it could be considered irrelevant for the analysis, while an “anomaly” is a behaviour that is different than expected in relation to some previously recorded behavior and requires a deeper dive and cause analysis. For example, in some telecommunication network, we can have a cell that is overloaded, and in this case – it is considered to be an outlier among other cells in the network. But if it happens that in the same network for some period of time several different cells have the problem of overload, they as a group can represent an anomaly that occurred, for example, due to some link failure, or congestion on the link that is connecting them.
Anomaly detection process should include these following steps, in order to be carried out in the right way:
Anomaly represents the type of behaviour in the data that differs from some expected behaviour. While the outlier can be interpreted as an instance that deviates from the rest of the instances, with no meaning, whose behaviour could easily be explained and thus ignored and removed, anomalies represent grouped or correlated outliers, deviations having a deeper cause different from simple human mistake or wrong reading, irregularities that are not so easily detected and explained, since they’re usually hidden among normal instances.
Anomalies could be grouped into three following classes:
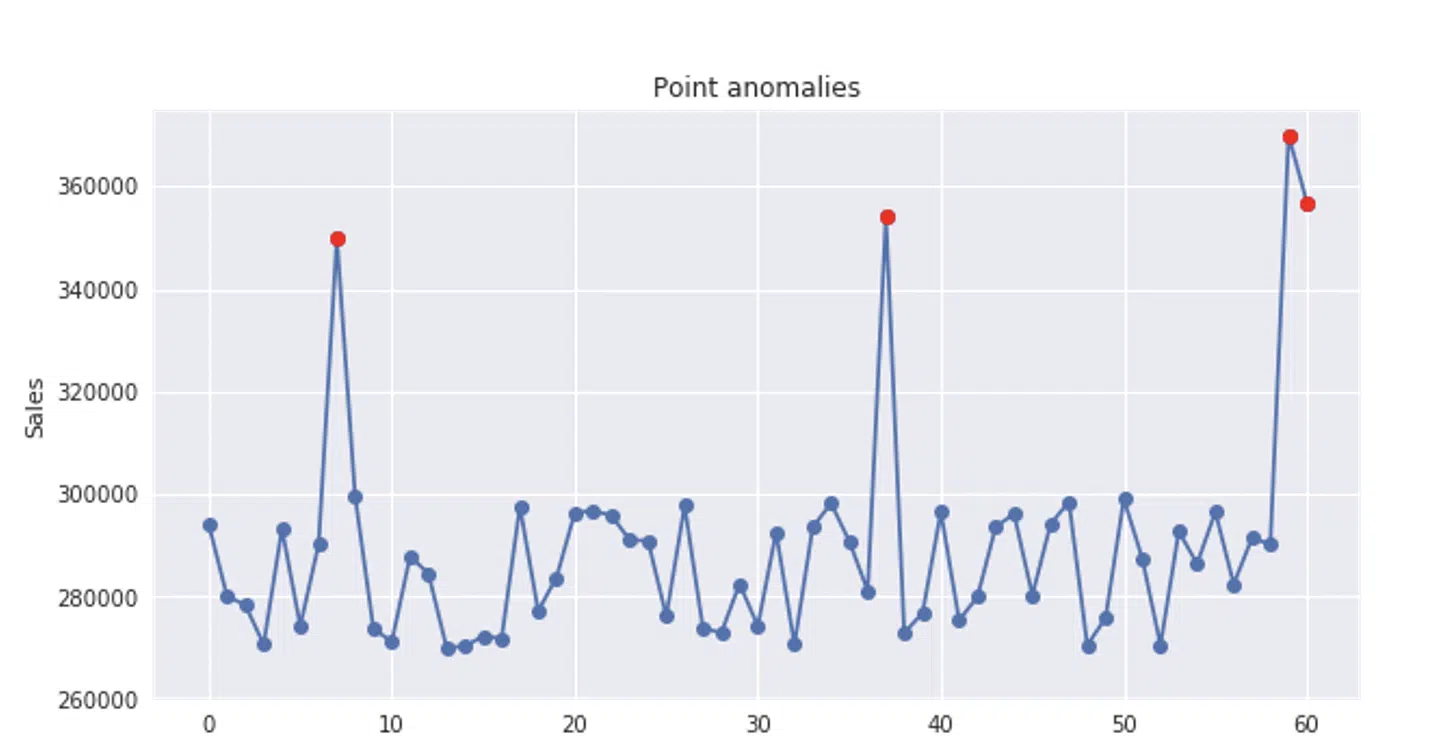
Point anomaly, as the term says, is an instance that could be considered as anomalous among other instances in the dataset. Point anomalies often represent some extremum, irregularity or deviation that happens randomly and have no particular meaning. I like to refer it as outlier. On the time series graph below, red points represent isolated point anomalies.
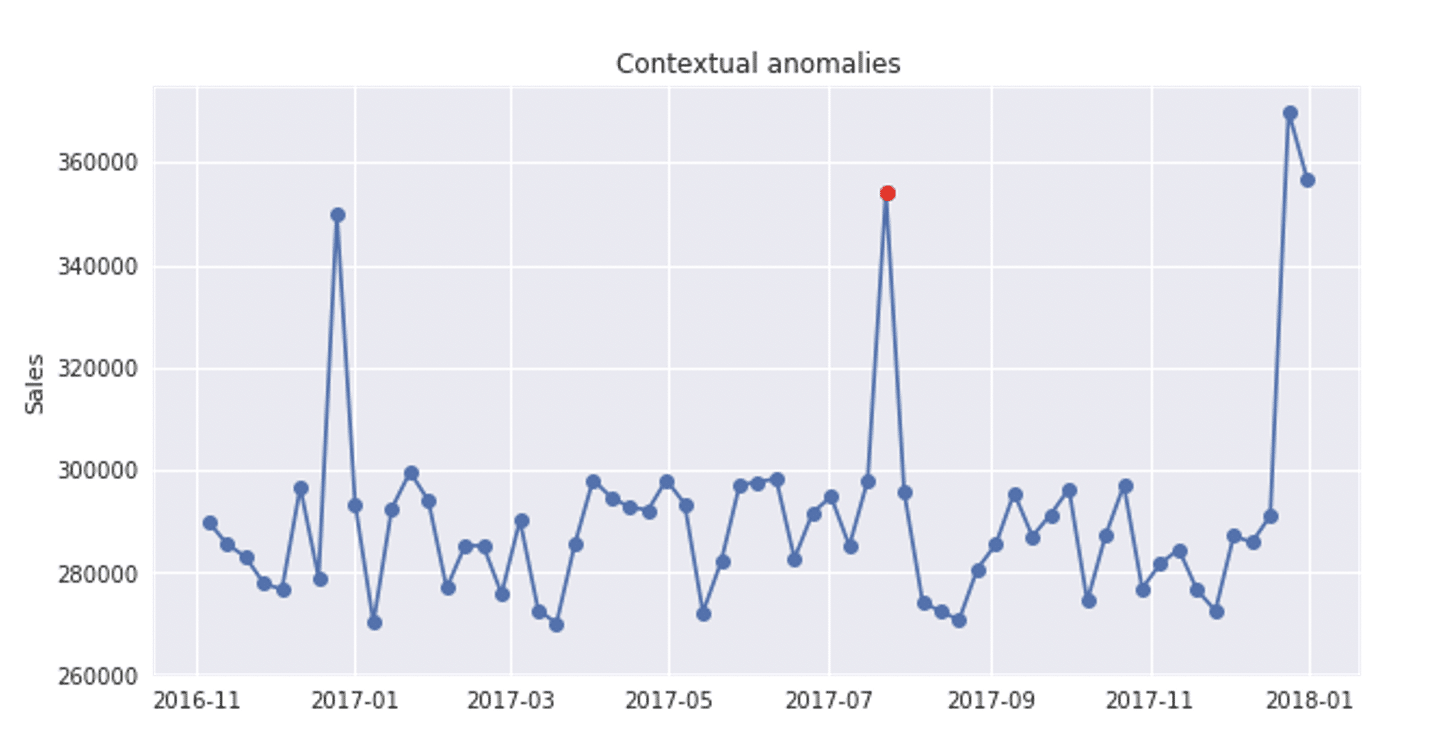
Contextual anomaly is an instance that could be considered as anomalous in some specific context. This means that observing the same point through different contexts will not always give us the indication of anomalous behavior. The contextual anomaly is determined by combining contextual and behavioural features. For contextual features, time and space are most frequently used, while the behavioral features depend on the domain that is being analysed – amount of money spent, average temperature, or some other quantitative measure that is being used as a feature.
If we add some contextual feature, like time dimension, the same time series will look like following. Similar values are differently flagged for different time periods. If the time series below shows sales for each month, seasonal peaks in the holidays’ period (December) represent a growth in sales due to higher number of purchases, while the peak in July, 2017, represent unexpected, anomalous growth, that requires deeper analysis in order to be explained – the cause could be some sale action, music festival, or sport event. There are anomaly detection libraries that have the possibility to receive date ranges that are expected to have extreme values for some feature that is being analysed.
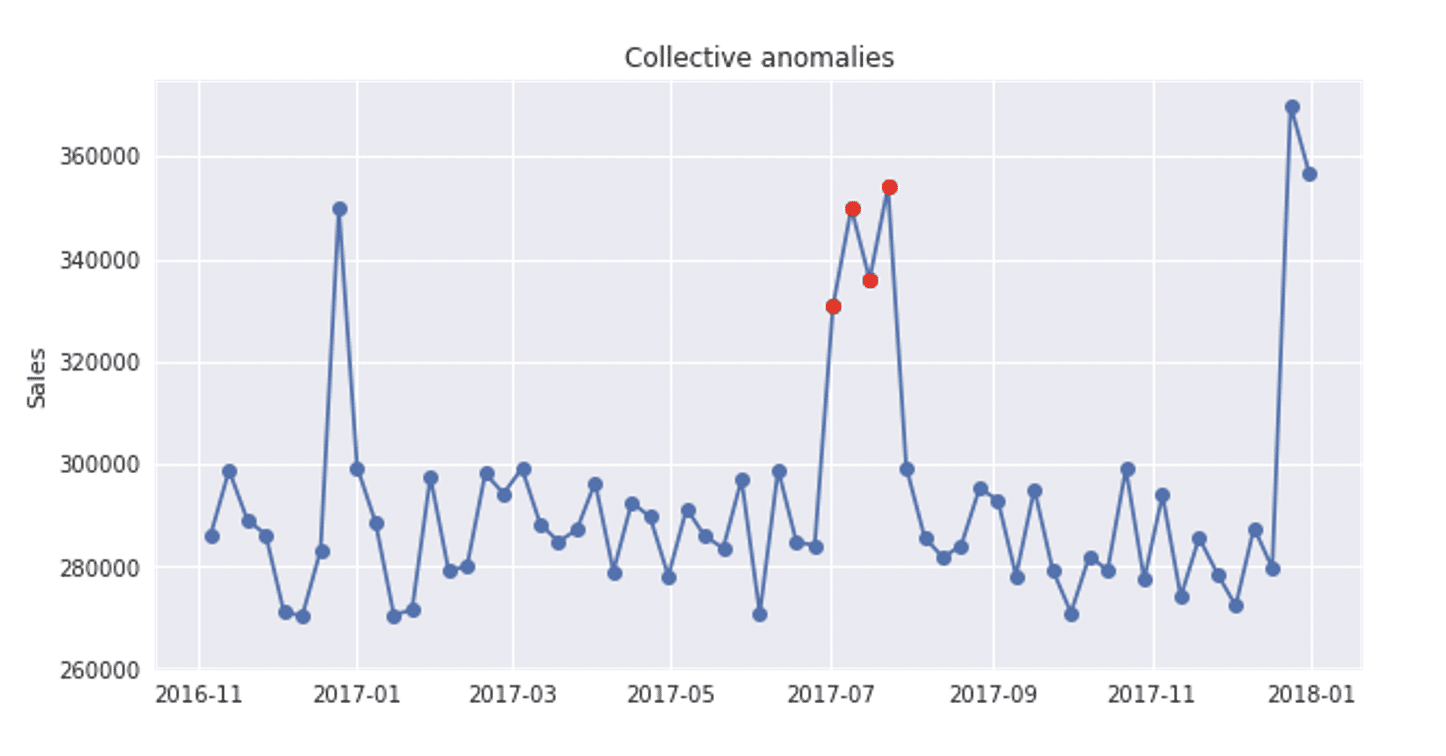
Collective anomaly is often represented as a group of correlated, interconnected or sequential instances. While each particular instance of this group doesn’t have to be anomalous itself, their collective occurrence is anomalous.
The time series below is pretty similar to the previous one, except that the growth is noted for the whole month of July, 2017. Since it is a one time event, there is no doubt that it’s about anomalous behaviour.
It is very important to stress that contextual and collective anomalies do not require special handling but deeper analysis and root cause identification. Sometimes it is very important to give valuable root cause explanation in order to handle and smooth these kinds of anomalies in a proper way.
Every anomaly detection technique belongs to one of the following basic approaches:
The selection of the right set of techniques depends on the data being available. With labeled data, the decision is pretty simple. A lot could be done when the information of normal and anomalous behavior is given. With partially labeled or unlabeled data, this task is more complex and kind of a state of art. Detailed description of the most famous anomaly detection techniques could be found here, along with assumptions needed to be satisfied for each one of them in order to be used, as well as pros and cons, and required computer complexity.
In my next post, I will be talking about Isolation Forest algorithm, and how it can be used to detect anomalies in the data.

The financial industry is undergoing a digital revolution, with traditional methods of banking being replaced by faster, more efficient, and…
Read more
The financial industry is undergoing a digital revolution, with traditional methods of banking being replaced by faster, more efficient, and…
Read more
You’re running a business, constantly looking for ways to cut costs, boost efficiency, and increase revenue. But here’s the harsh…
Read more
Agentic AI will transform industries, but with one important exception — without consolidated data, even the most sophisticated AI systems…
Read more