How to boost online sales this holiday season with a personalized shopping experience
The holiday season is the most crucial period for retailers. Besides high sales volume, it is also an opportunity to…
Read moreThings Solver: Agentic AI + Customer 360 + Data Management
28. 08. 2020.

Although EDA is often observed as an initial step which should be straightforward, there are some challenges that could slow down and make this process poor and painful. Some of the challenges I have encountered so far are listed below.
Poorly defined business problem (and not having the understanding of it). Not having a clear problem that should be solved can make you wander around without some specific goal, which can be positive and productive, but in most cases – you will feel lost and wouldn’t know what to do with all the data you have in your hands. On the other side, if you don’t understand what the main issues the business is facing are – you will have troubles extracting insights that are helpful, since you will focus in the wrong direction.
Not having the right data (nor talking to the right person). Although the problem is defined and well-understood, not identifying the right datasets that should be used, or not having the chance to talk to the person which knows the data in detail could make the EDA a hell of a ride. Neither you, nor the client will benefit and be satisfied with the EDA results – and that is not what you want to obtain with this process. Make sure you have the right data, and you have the right “go-to” person, for every question related to domain clarification, data gathering and merging, etc.
Messy data and (no) warehouse (causing defending attitude of the “go-to” person). In most cases the data will be messy. Foreign keys mismatches, no IDs to join the information from multiple sources on, wrong calculations, etc, etc. Sometimes when you try to merge some datasets, and find out there are differences in IDs, or duplicates, or something else, and you got to the person being in charge for data maintenance – that person may go rogue. They are focused on explaining the reasons of mismatch and mess, and not on giving the directions on how to make things right – or even do it. Be clear with what you want to do – you want to clean up your data (and get help to do that, if needed) in order to present how data science could help in leveraging some process, not to point out the messiness and neglection of people in charge of data maintenance.
EDA done on auto-pilot (reports being containers, not insights treasury). Sometimes the problem is that EDA is found boring and oversimplified. It is done just to follow some defined flow, in order to say that you have done it, and then jump straight into sophisticated and complex ML algorithms. Most of the problems can be solved in the early stages of EDA – it is not easy, though, but if done right – you’re halfway there. Next time you’re doing EDA – rethink your approach, in order to identify if you are skipping steps and doing it with half a brain, just because you find ML more interesting (which IMO is unacceptable, thorough EDA and data understanding are prerequisites of ML application).
Not having a big picture. Remember what is the main purpose of EDA, and the goals you want to achieve through it. Not knowing why you do something will suppress your creativity, innovation and critical thinking. This results in extracting one-time insights. EDA per se is allowed, but it is more applicable and useful if you do it in order to facilitate future analysis and steps that will be taken.
In order to make this process understandable, I have tried to present some main steps and guidelines found in the image that follows (from the client-vendor perspective, but if otherwise, an analogical approach could be applied).
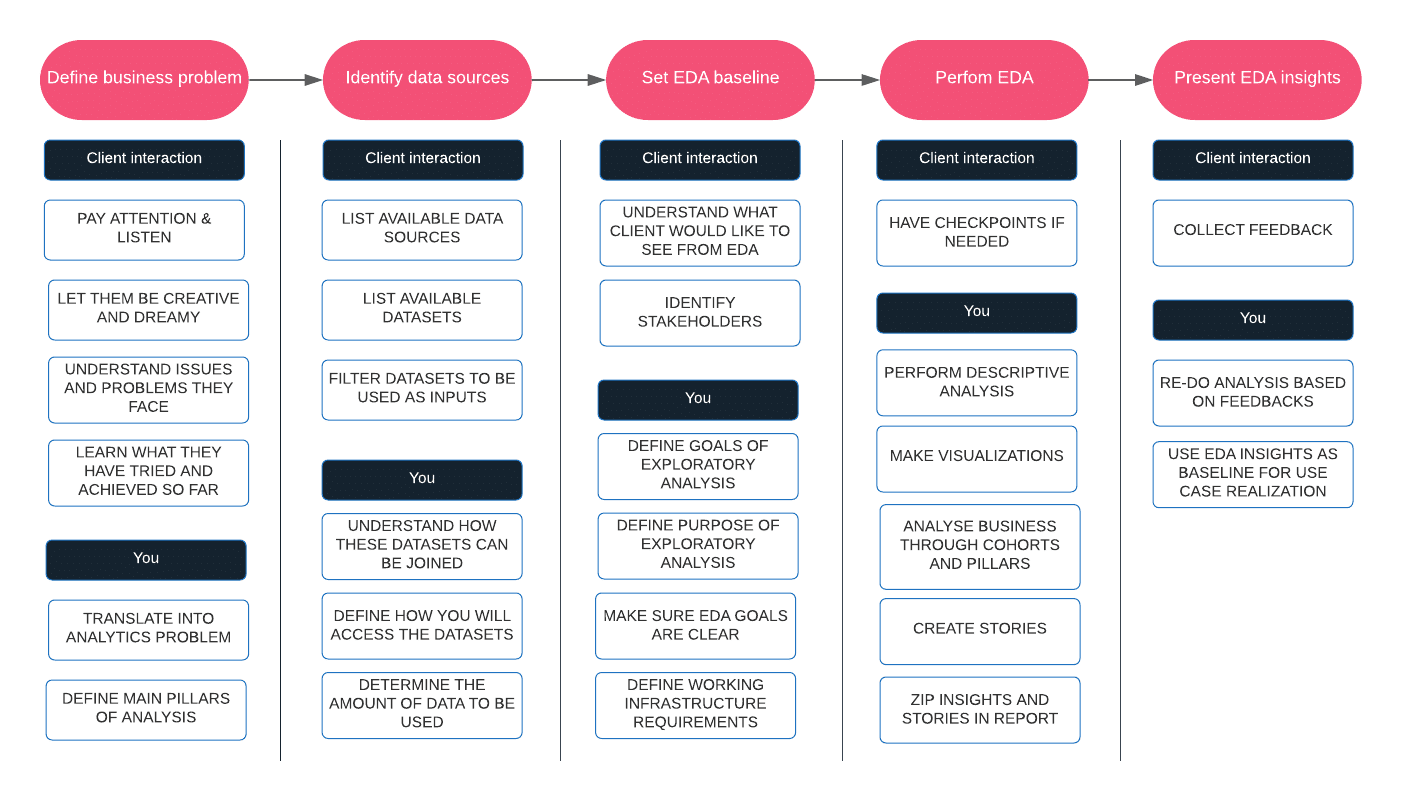
If you want your EDA to make sense and have a purpose, start with the problem. In this step, the most important thing is to listen to what the client is saying. It often happens that they know which data is useful, but don’t have the expertise to utilize it. On the other side, maybe they have tried to perform the analysis and solve the problem by using data – manually, and your job is to help them speed up the process. In some cases, it may even happen that they have never joined information from different departments, and don’t have the overview. Many different scenarios could happen, and that is why it is important for you to listen and not make any preassumptions. Translating into an analytics problem means understanding if and how data analysis can help in solving the issue. Definitining main pillars of analysis stands for identifying perspectives of analysis that could be applied – what are the main entities/business areas that could be analyzed and how they are connected. The main output of this step is to come up with the problem that should be better understood and finally – solved.
Lessons learned: don’t make preassumptions and let the client communicate the biggest issues.
Sometimes, there can be hundreds of input sources coming from various systems and placed in different locations – the goal of this step is to identify which sources contain data that best describes the problem you want to model and solve. Not all sources are (equally) important. IMO, it is better to start small – filter some representative input dataset contained from a couple of different sources to perform tailored analysis, than to have a vast amount of (not investigated) data, not knowing where exactly to start from. Having big data can be good, it could help in having the data describing different areas of business, but at the same time – can be your worst enemy if you don’t have a focus nor know how to filter information needed at a time.
Lessons learned: don’t start with tens or hundreds of tables not knowing how to join them, or filter relevant information.
Okay, to set one thing straight – doing EDA just to be compliant with some methodology sucks. EDA is the main prerequisite for a fruitful and successful analysis, based on data, statistics and machine learning. Doing EDA without purpose or clearly defined goals will make it painful, useless, and overwhelming. There are crucial points to be defined as a baseline for doing EDA:
Lessons learned: make sure you have all the prerequisites satisfied – business problem, purpose and goals, working infrastructure and stakeholders.
Be creative and utilize everything you picked up from the first step – business problem definition. Think about everything you have learned so far, from your own experience. Use analogy – although there are different businesses with their own functioning mechanisms, it often happens that some analysis you have performed in one use case, can be applied to another.
There are two main purposes of exploratory data analysis:
In order to do that, one has to understand that although, for example, extracting correlations and visualizations are a must-have, and a helpful tool – they are not to be analyzed by the clients. You are creating the analysis for yourself, but in order to tell a story (to the client) based on that analysis. A report is not only a container with tables and graphs, but a utility guiding the reader and telling a story which reveals insights, irregularities and directions for improvements, characterizing the use case (business problem) being defined. So – next time you create an EDA report, ask yourself – what is the value of this report? It is useless if you don’t have a basic understanding on how and why you have done it.
Lessons learned: create a story that will guide the reader/listener through the analysis, from the problem setup, to the methodology and finally – insights.
This is your moment to shine. When you present EDA insights – you have to make a point. Why is it useful, what are new learnings obtained – how that can be used for future analysis and modeling. In most cases, some things that are weird or unexpected to you – are a completely regular thing to the clients, since they know much more about their business. And sometimes it happens the opposite. The idea is to use EDA as a guideline for defining next actions and use case realization. Collect feedback on the analysis and insights presented – sometimes some enrichments, further data cleaning and modifications should be introduced.
Lessons learned: make a point (or multiple ones) with your analysis, and collect feedback on the analysis you have performed.
The real deal – referring materials
I have found this comprehensive list of automated EDA libraries, and have used some of them myself (all time favs: Pandas-profiling, Sweetviz, and Yellowbrick). Additional links can be found in the following list:
Tell me about your experience, I would like to hear your best practices and overcomings of often-faced challenges.a,
Cheers! 🙂
Cover photo taken from: https://unsplash.com/@clarktibbs

The holiday season is the most crucial period for retailers. Besides high sales volume, it is also an opportunity to…
Read more
The holiday season is the most crucial period for retailers. Besides high sales volume, it is also an opportunity to…
Read more
A closer look at analytics that matter You’ve trained your AI agent. It runs. It talks. It reacts. But does…
Read more
Imagine having a team of top chefs, but your fridge is packed with spoiled ingredients. No matter how talented they…
Read more